BlackRock - The GIANT money institution with almost $10 Trillion under management...
Today we look at BlackRock [BLK] and observe its fundamentals.
It’s not sensational, but it has been gently compounding
Disclosure: As of 18/04/2022, I do own a position in BLK, I am not suggesting to buy or sell this equity.

BlackRock operates in many settings, one its largest being an institutional investor, eg. being the vessel for ETFs, possibly retirement accounts, including but not limited index funds, thematic funds and even ESG related.
For example, if you wanted to invest into the S&P 500, you may invest into the ETF IVV which is managed by BlackRock or VOO which is managed by Vanguard, both charge very low fees (less than 0.10%) in this circumstance as there is minimal upkeep required to run these funds.
Other funds that BlackRock runs may be more active for example BST - BlackRock Science and Technology (Full disclosure, I do own a position as of 18/04/2022) which has a significantly larger expense ratio of 1% of one’s position, this ETF has positions in closed private companies and also manages option contracts (selling covered calls).
These fees, depending on the product make up towards BlackRock’s revenue and thus earnings. This could be compared to Mastercard & Visa which charge a percentage of total transactions for example.
Assets under management
Its assets under management has grown from 3.3 trillion since 2009 to over 9 trillion as of Q1 2022. One may consider, that there is a relationship between AUM, revenue and earnings, as AUM increases, so can revenue and thus earnings.
$1000 in 2009 in BLK stock would be worth roughly over $7000 today…
Growing top and bottom line…
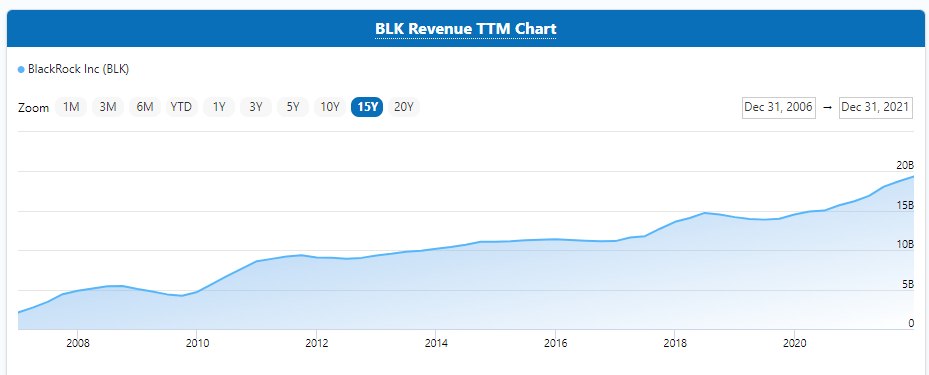
BlackRock’s revenue has grown between 7-20% annually over the last 15 years, from as just over $3 billion to over $20 billion.
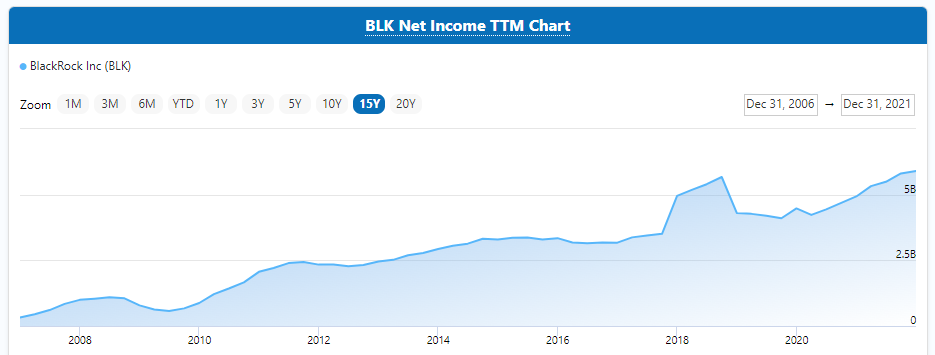
It’s earnings as also followed… from less than 1 billion, to over 5 billion in net income.
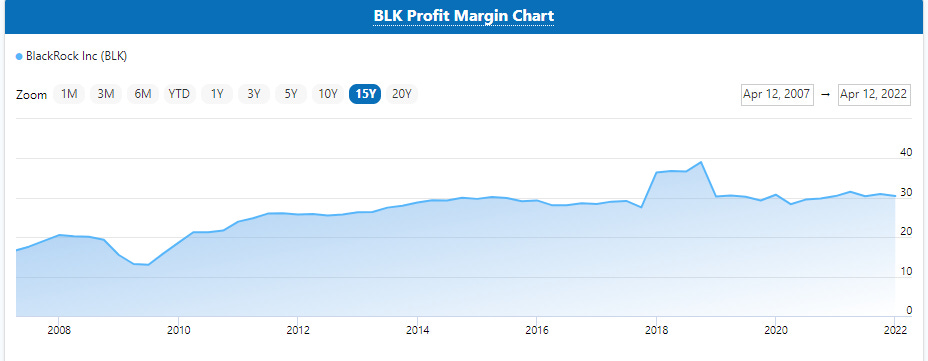
Along with its profit margins… growing reasonably from 20% to 30% (which is an increase of 33% over 15 years).
Growing ROE, FCF & dividends
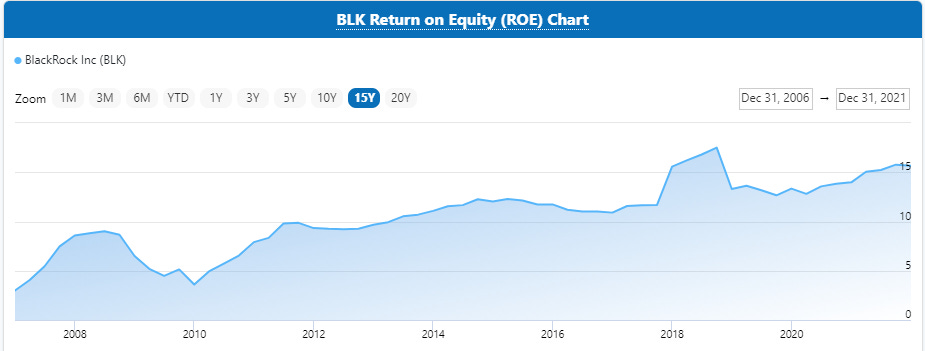
ROE - an observation on how much returns a company and earn based on the shareholder’s equity, in this case this metric has been growing over time from 10% to 15%.
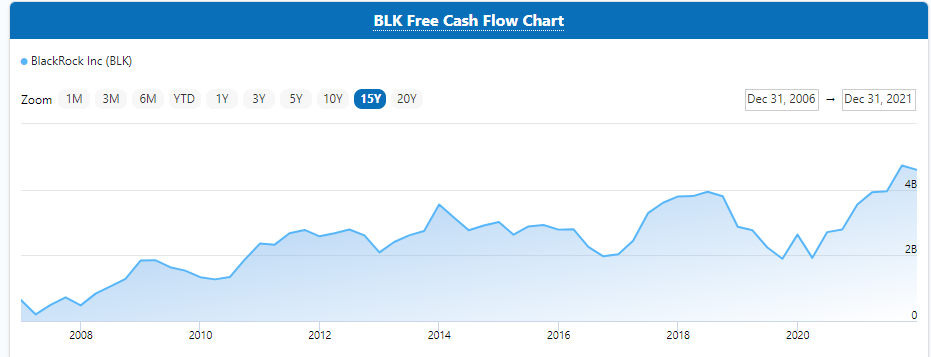
FCF - similar to earnings but falls under different accounting measures which often can be seen as how much money does the company have left over after paying all the bills at the end of the quarter.
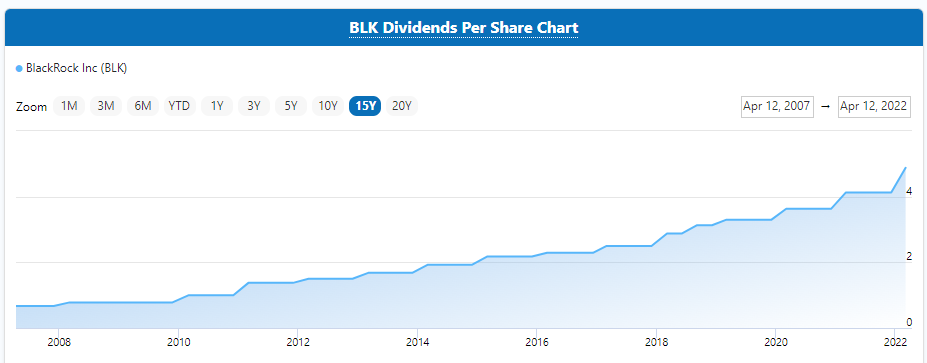
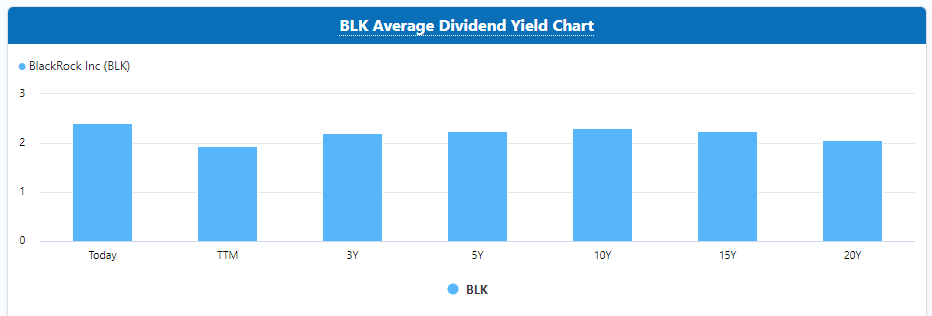
Simply put, holding BLK for the last 15 years would have grown your dividends over time for holding the same amount of shares, scaling from less than $1 per share to over $4 per share. This is likely from the fact that BLK has kept its dividend yield the same, so as its earnings grew, so did the dividend, naturally.
Steady dividend
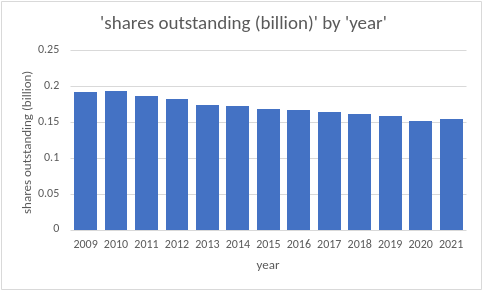
Steady share buy-backs
BLK has also returned its earnings via share-buy backs, this can mean that each shareholder receives a larger piece of the “pie”, increasing EPS (earnings per share) over time.
Balance Sheet?
BlackRock has been steadily lowering its debt from 44 billion to 22 billion between 2015 until now, noting that shareholder’s equity continues to increase, allowing overall debt to equity ratio’s to decrease from 1.61 to 0.45 (over twice as much equity as it has debt).
More info here: https://www.macrotrends.net/stocks/charts/BLK/blackrock/debt-equity-ratio
Valuation?
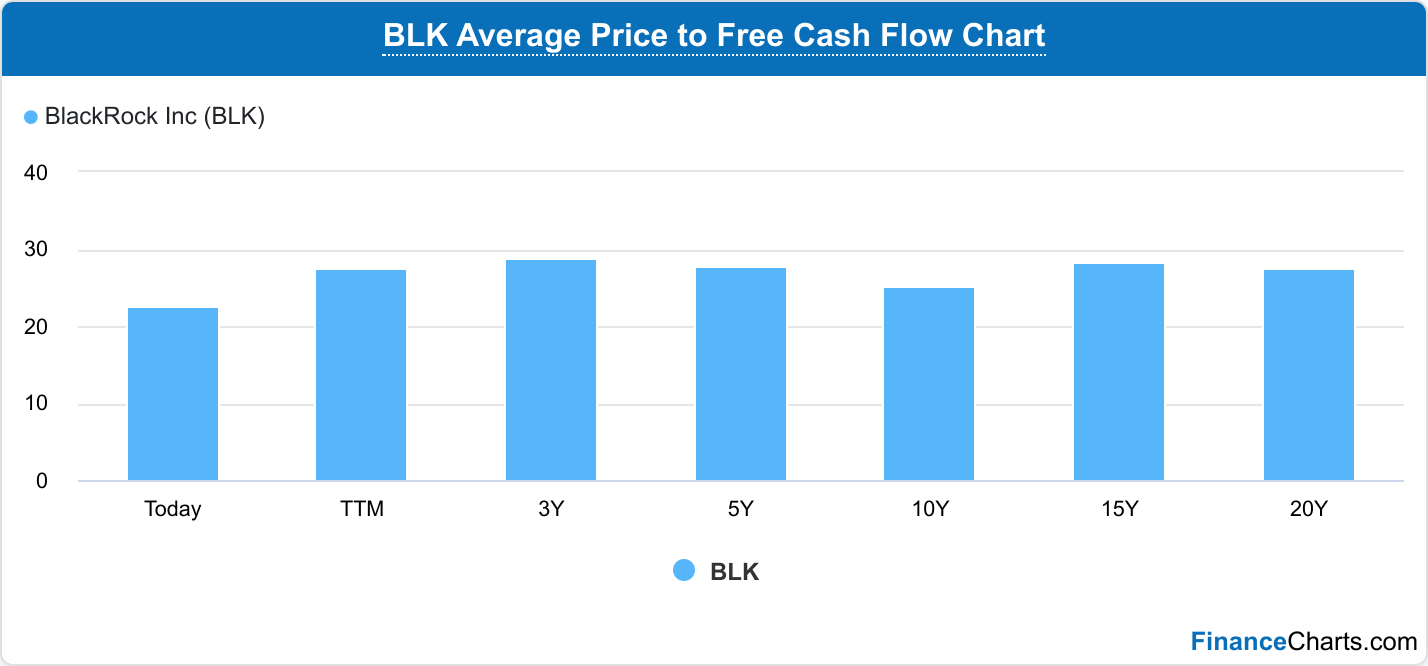
A valuation that could be observed would be a companies price to earnings (P/E) and price to fcf (P/FCF). Note that the market is forward looking, often a larger ratio value could indicate increased growth, and lower ratio for decreased growth (Meta stock for example, which we may look it in the future). It may also mean that the market is over or under valuing a business. This may be difficult to determine, hence valuations may be only part of the equation.
It can be observed that BLK is valued slightly less than its historical average. It does not necessarily mean its under valued, the market might be expecting slowing growth or fearful of the future. These are things to consider.
Headwinds…?
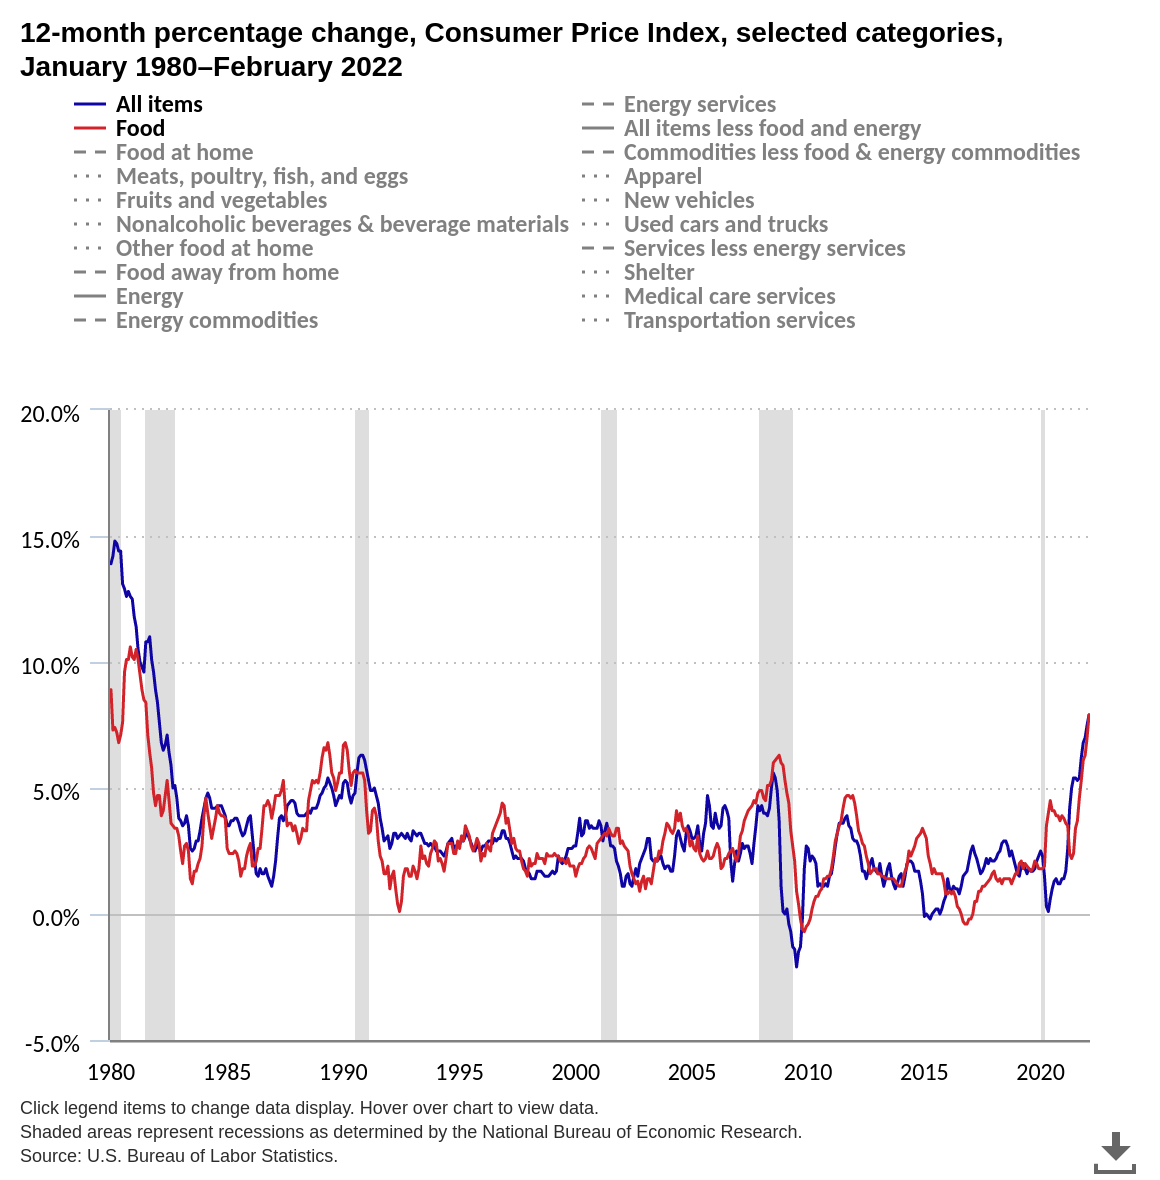
As of writing this, there are multiple uncertainties and larger macroeconomic conditions. These may include: increasing inflationary pressures, possibly attributed by covid-related supply chain crunches, Russia - Ukraine conflict, recent slowing of China GDP.
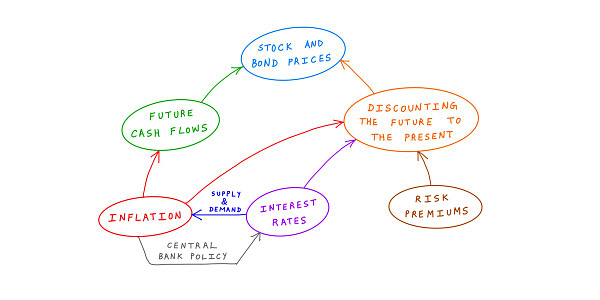
Inflation and interest rates have a little bit of a relationship, as inflation increases, a country’s reserve bank (Fed for the US, RBA for Australia) may increase interest rates in order to reduce inflationary pressures. As a result, consumer spending may be dampened but also asset prices and mortgages rates may be influenced (often in a negative way for the consumer).
10K diver does a great analysis on this

Some quick math…
Using a DCF model, I punched some numbers in, with assumptions that it might grow by 10% next year and have its decay rate drop by 2.5% (97.5% of 10%, 97.5% of 9.75% the year after that etc), it could return 7-8% annually on those conservative assumptions.
In a plausible optimistic scenario, if it continues its buy backs, dividends and growth of 12-15% it could return 15-16% annually.
Conclusion
BLK has compounded as a business in size and earnings power. Though one does not know where the future holds, BlackRock may continue to grow if one’s assumption is that the world continues to innovate and develop.
Thanks for reading to the end! Hope you enjoyed the content.
Till next time…
Special Acknowledgements
Shout out to financecharts, great source of data in very easy to read format! It definitely saves alot of time vs mulling through individual quarterly and annual reports. P.S - It’s free and no, this is not a sponsorship advertisement either.
https://www.financecharts.com/stocks/BLK/growth


